Launch HN: HyperProbe (YC S26) – Agents that do read-only debugging in prod
Posted by shailendraht 1 day ago
Hi HN, this is Shailendra and Karan here. We are building a fast and safe way for coding agents to debug issues live in production.
When prod breaks, it lets Cursor, Claude, and others drop virtual breakpoints or probes safely in your running code, and extract the exact variable values that logs don’t have.
All this saves time and effort for engineers who’d otherwise dig through logs and traces or redeploy with console.logs or print statements until they find the root cause.
Here is the link to the video that explains this: https://www.youtube.com/watch?v=ivV7I--ta5c
Agents write most of our code now. This shrinks the useful context engineers need to debug AI written code, a problem not helped by the limited telemetry added in the same code by AI.
So when something breaks in prod, the first instinct for an engineer is to open logs or throw them to your agents. But if the line you are looking for is not there, agents will start guessing the root cause on non-existent data, forcing you to add a log, and redeploy.
This analysis-inference loop of agents with existing data does not come cheap, burning a lot of tokens. And the add log, redeploy cycle is so slow and painful that it makes engineers hate on-call.
Our approach lets agents capture telemetry on-demand at the exact moment and point of failure, killing the log-redeploy cycle and getting the most accurate RCA while burning fewer tokens.
The obvious problem is making it work on a running service. You can't pause a live service the way you'd pause a debugger on your laptop. Getting the value out of a running process safely, without pausing a thread or slowing the host is the challenge.We are making this happen.
Before this I ran engineering at a 100 member team. Then Karan and I spent three years on HyperTest which was a testing tool.
At HyperTest, we turned production traffic into integration tests using OpenTelemetry. That was production instrumentation too. The hard parts of pulling real runtime state out of a running service without breaking it, were the hard parts we learnt to put together.
We learnt some other lessons the hard way too. HyperTest tried to prevent bugs with better tests, and adoption was a fight every time. Calls kept getting cancelled because teams were firefighting production. Testing was hygiene. Broken prod was hair on fire. This made us see where priorities lie.
This seeded the idea of building a truly autonomous on-call agent i.e. one that takes an alert, probes, diagnoses and fixes it in a few minutes. But this is how it works as of now:
You talk to your coding agent the way you already do. Tell it what's wrong: "checkout returns 200 but some users are seeing their order fail, find out why." It locates the line in your local code, connects to us over MCP, and drops a probe on that line in the running service. The probe is read-only and sits dormant until real traffic hits. When hit, it captures the local variables at every frame of the call stack at that exact moment. It hands them to the agent, which diagnoses with real data.
There are two pieces. An SDK that runs inside your service, and an MCP server your coding agent talks to. The SDK is what makes setting probes (virtual breakpoints, log or metric) possible without a redeploy. In Node and Python it hooks in-process. In Java it attaches as a JVM agent, instrumenting at the bytecode level. Either way the service keeps running and serving traffic. Nothing pauses.
When your agent wants to look at a line, it calls the MCP server, which tells the SDK to place a probe there. When a request hits the line, the SDK captures what the probe asked for, sanitizes it in-process, and streams it back to the agent via the MCP.
This can run inside prod, so a probe can read any value sitting in that variable. We ensure redaction happens in-process, inside your own container's memory. This is before anything goes on the wire. Keys like password, token, authorization, ssn and credit card are redacted by default and you add your own.
Also the probes read but never write, and if you want no captured state to ever leave your network you can self host the server, broker, and even the database in your infra.
On overhead: when idle, the SDK adds negligible memory and effectively nothing to throughput and response time. Probes only cost anything while actively capturing. Also captures are bounded. A separate monitor watches in real time and pulls every active probe if overhead ever spikes.
Every log-and-trace tool hands the agent data that already exists and asks it to reason backward to what probably happened. We think it is more useful to give agents eyes and ears into the running code, so they capture what they need when they need it, right at the point of failure.
This seems like the simplest and fastest way to debug prod incidents.
We’d love the community to try this in any environment to debug any known or unknown issue by just chatting with your coding agent. And let us know what more features you need to make this a truly autonomous on-call agent
Supported platforms: NodeJs, Java, Python.
Comments
Comment by tizerluo 1 day ago
Comment by karanraina 1 day ago
if any guardrails fails, we suspend probes till cooldown.
also 1. every probe is bounded by hits/expiry time (whichever comes earlier) 2. hit budgeting happens with a token bucket at a global level, per probe was an overkill (numbers are configurable) 3. we even measure the execution time that probes have when active and suspend if that that takes longer than threshold (again configurable) 4. we even have budgets for the network bandwidth it would take (approximated by the size of payloads) 5. collection itself is bounded by max no of total snapshots we can keep in memory. 6. every snapshot has a size limit as well, every variable has a size limit as well. 7. depth of objects, no of objects, size of lists is capped by default.
latency delta varies by platform under load but is mostly negligible
nodejs: ~7-10ms python: ~4-9ms java: 1-2ms
the main reason for this is guardrails suspending probes, having loosened guardrails will increase this under load
regarding localization of failures.. absolutely we even report the error in the probe snapshot (confirmed by adding side effects in an expression and commenting out the guardrails during testing)
huge payload size doesnt matter.. we limit the objects depth, list length, remove duplicate refs from data etc.. even string length is truncated., but even if it happens, your request would still survive.
also, even if the collector dies or there's a network failure, your service remains unaffected, we just are unable to collect telemetry
we are boring under extreme conditions :)
Comment by doublerebel 1 day ago
> Every log-and-trace tool hands the agent data that already exists and asks it to reason backward to what probably happened
If the app is using a decent instrumentation tool, the data shows what 'actually' happened, not what 'probably' happened.
> "checkout returns 200 but some users are seeing their order fail, find out why."
Does this tool only exist to shore up poor system design? Failing orders at any e-commerce business I've worked with, large and small, are a huge red flag. Typically that is one of the first actions that is logged and traced (alongside onboarding/login), and the metrics are actively monitored. Returning 200 for failure and not catching that error is very bad API design.
Similarly, putting engineers in a situation where debugging requires accessing unknown amounts of live sensitive customer data is generally considered bad practice (even if it happens often IRL) -- in a hurry to debug, it's easy to miss that a property should have been redacted; by then it's too late and sensitive data is exposed. Plus, in most systems with significant usage the volume of trace data is prohibitive to individually examine and search through. That's why Rollbar etc aggregate errors and captured data to identify patterns before a human (or agent, or tool) ever takes a look at it. A single captured instance can also be very misleading as to the true cause.
How are you addressing these common concerns?
Comment by karanraina 1 day ago
These work only on either uncaught exceptions or wrapping up caught exceptions with their sdk. These tools will not help you with silent failures, like logic bugs where code executes cleanly without throwing, but produces the wrong business state. If every problem in your app ends up as an exception, sure you'll be able to catch the symptoms of where the exception got thrown. we can deal with these too, but these tools cant deal with the messy bugs where no exception fires.
> Such very mature tools exist that auto-instrument, collect variables from the call stack, and pinpoint error causes.
That is true for python using frame.f_locals (we use this as well)
nodejs only gives it only till the lasy async boundary, after that v8 itself drops this data. java only gives you the current frame, to get variables beyond that you would needs JDI/JVMTI which would block your threads, usually unnacceptable in production
To get around this safely, we add multiple probes all across the call chain and collate collected data using the traceId from the context (or thread id as a fallback);
> Does this tool only exist to shore up poor system design?
Returning 200 OK on a silent failure is 100% bad system design, I completely agree. But real-world production systems are full of legacy edge cases. (if that weren't true, L1/L2/L3 support team shenanigans wouldn't exist)
Also, the exception will tell you that an exception occured in order service in GET /orders/{id}/payment, your trace will tell you payment service is giving 404 for that order ID
what it wont tell you it happened becuase the webhook endpoint that your payment gateway calls is now receiving a new payment state called 'PENDING' and that you dont handle but still mark the payment as 'processed' for idempotency check. and now your order service is calling the payment service and its giving 404 because it never got written
Bad design. 100% Agree, but has happened IRL.
> putting engineers in a situation where debugging requires accessing unknown amounts of live sensitive customer data is generally considered bad practice (even if it happens often IRL)
I think tells that teams would go to these extents to fix issues. Not ideal. I agree.
> in a hurry to debug, it's easy to miss that a property should have been redacted; by then it's too late and sensitive data is exposed
fair critique. we currently use in-process rule engines to filter known sensitive patterns, and users can add on to it. but we are also building out-of-process secondary checks (using NER/classifiers) to sanitize payloads before storage. It requires strict rules, but getting verified runtime evidence is far safer and faster than blindly guessing and shipping trial-and-error hotfixes to production. or waiting to be too sure.. a luxury that might not be possible everytime.
> Rollbar etc aggregate errors and captured data to identify patterns before a human (or agent, or tool) ever takes a look at it.
There is merit in that as well, if you are looking at so many logs/traces, you kinda have to do it. We have a different approach, we use hypothesis driven conditional probing instead. probes are dropped dynamically as the understanding of the bug evolves in a session
exmaple:
console.log('hello');
const x = await getThisValueSomehow();
if (condition A) {
console.log('i m in condition A');
// do something;
} else if (condtion B) {
console.log('i m in condition B');
// do something;
}
You can also place a probe before the branch to capture variable state when neither condition evaluates to true. You gather precise data on demand rather than paying to store petabytes of static trace data.
> A single captured instance can also be very misleading as to the true cause.
We collect multiple snapshots per probe run. However, because we capture full variable state at the exact execution line, a single snapshot frequently reveals the root cause for that specific failure path. If that snapshot raises new questions, you/your agent simply drops more probes deeper down the call chain
Thanks! This was very insightful
Comment by kirtivr 16 hours ago
When I looked into this a while back I explored using ptrace() to add breakpoints and even add functions at specific line numbers. But ptrace is so slow, and it doesn't work with bytecode-in-VM setups.
What were some of the requirements you guys had when building HyperProbe? I can see low latency was one.
Comment by karanraina 7 hours ago
we work at the application layer by hooking into production grade tooling if available (inspector in v8, sys.monitoring in python) or bytecode manipulation(jvm)
since we arent controlling the application for a different process, we dont need to freeze the app to get the current app state
requirements we had in mind in order of importance
1. safety -> user app needs to function as usual no matter what happens, there shouldnt be an error in the user's app because of us
2. zero idle footprint -> if no probe is active, cpu/memory differency in the user app should be immeasurable
3. zero latency footprint at non probe paths while other probes are active
4. measure mem/cpu footprint directly or via a proxy like eventloop lag and have guardrails around it. suspend probes or even lose snapshot data if guardrail conditions meet
5. minimal mem/cpu footprint for active probes
6. minimal latency foot print for active probe paths
Comment by vitorbaptistaa 1 day ago
For people that don't have these neat observability tools (like me), I've been using https://shellshare.net (disclaimer: I made it).
This is a single command to share a terminal live with e2e encryption. Originally it was for teaching classes or helping colleagues, but it's also very helpful for agents. I SSH into prod and run:
> npx shellshare exec --json -- tail /var/log/my-app.log
This generates a URL, then I can tell any agent:
> monitor <URL>, instructions in https://shellshare.net/llms.txt
They can see the output live. No need to install anything in the agent's machine. Next shellshare version it will be just "monitor <URL>" and the agent's instructions will be in the URL itself.
Nothing even near what you've guys done, but it has been helpful for me. Best of luck in your startup!
Comment by bluelightning2k 1 day ago
How does it work? Using the NodeJs inspector API or other language equivalent to drop breakpoints? Those APIs are unavailable in many serverless environments and are challenging to use alongside bundlers.
Comment by karanraina 1 day ago
You're correct inpector API is not available in many non-v8 targets. Bun also has somewhat of a partial support for inpector API but at least has a programmable debugger interface. It's not going to be as fast as native inspector but its better than nothing i guess :P
for python sys.monitoring. for JVM, we do bytecode manipulation itself.
bundlers are not an issue because we support sourcemaps. We just need mappings, not code in the sourcemaps and we do sourcemap resolutions out of process so that your app doesnt spend ~200 MB of memory for parsing sourcemaps
Comment by bluelightning2k 1 day ago
Comment by shailendraht 1 day ago
Comment by anshulmotwani 1 day ago
Comment by shailendraht 15 hours ago
Comment by manos-saratsis 22 hours ago
Comment by denis-stable 16 hours ago
Comment by shailendraht 15 hours ago
Comment by Natalia724 1 day ago
Comment by karanraina 1 day ago
all the rules get compiled into a single regex pattern, that lets us save on iterations.
Comment by karanraina 1 day ago
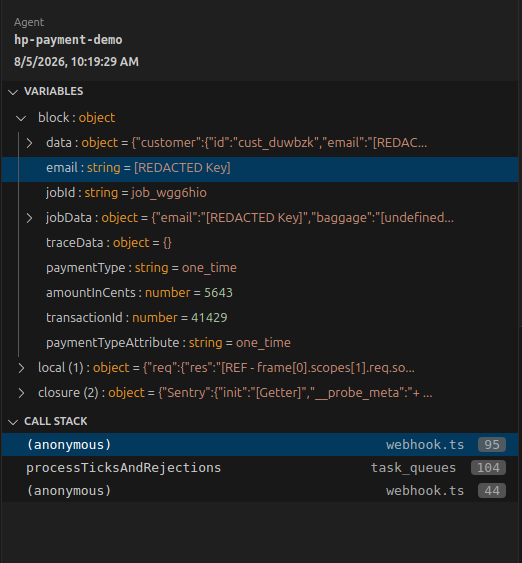
https://i.postimg.cc/jSmRpnRX/Screenshot-from-2026-08-05-10-...
Comment by MdJasimuddin 1 day ago
Comment by karanraina 1 day ago
You're correct, serverless is a bit tricky. CPU gets suspended the moment your function returns. The way it works is that you wrap your functions with a wrapper in our sdk.
that wrapper is supposed to track if there's telemetry to be sent, if so.. it sends it, otherwise, return as usual
this makes sure that when there's no active probe, there's no latency added. But when there's an active probe.. ~100-200ms could be added in the worst case if the probe is just before the return.
again, this isnt a problem in non serverless worloads because the CPU is always on.
but since probes are bounded by time and count, this will go away as soon as the time or count condition meets. beats adding new logs and redeploying in my opinion
Comment by bluelightning2k 1 day ago
How does the probe function technically. Inspector API I believe is unavailable on CloudFlare etc.
I once wrote something like this which could work on serverless platforms without the Inspector API. It used Typescript AST transforms to insert no-op listeners at every line, so they would dynamically eval or dump breakpoint style if a listenToLine parameter equalled their line, otherwise no-op. So trivial but not technically zero runtime cost.
Comment by karanraina 1 day ago
makes no difference if its cold or warm start. (The latency because of us, not latency in general)
Using AST, that's clever actually! I thought along somewhat similar lines. User tree-sitter. But it needs a build step! not sure how people feel about that :D It changes your source code itself so we'd need a 2 tiered source resolution. Dirty, but doable.
And instead of having this at every line, i did this at "lines of interest" before and after every scope ends.
so at the start/end of an if condition, start/end of fn definiton. it sort of worked, but it slowed down our synthetic benchmarks for "no effect when probes arent there" by more than what i wanted to tolerate and it depended of eval which i thought devs wont accept. and using node-vm slowed it further
But will give another try again. thanks for sharing this!
Comment by bluelightning2k 1 day ago
If you are transforming anyway you're looking at virtually zero dev time cost and runtime cost when no probe is active of less than 1 ms.
This approach survives any environment I know of and has almost zero runtime cost.
Comment by anigbrowl 1 day ago
Consider putting this near the beginning rather than 2/3 of the way down your pitch. I nearly stopped reading because these dramatic 1-2 sentence paragraphs are unpleasantly like listening to TV commercials. I think your target audience should not be CTOs or their direct reports, but engineers themselves, and I think you need a more focused pitch that takes less time to get to the point.
Anyway, an MCP-managed passive debugger seems like a useful tool. Best of luck with it.
Comment by karanraina 1 day ago
Although, our primary sell is debugging, the context from production on how things work currently helps ai agents during feature development and code reviews as well.
Comment by prasanna-gyde 1 day ago
Comment by prasanna-gyde 1 day ago
Comment by Brikuio 15 hours ago
Comment by sgarland 1 day ago
If you don’t know how it broke, and you don’t know how you fixed it, what exactly is it you think you understand about your application?
Comment by karanraina 1 day ago
what we wanted to convey is that sometimes people confuse "the symptom went away" with "the root cause was fixed"
I have seen that a rollback, a quick redeploy, or a temporary drop in tenant load makes the alerts go away and issue is considered resolved. specially true for larger teams with many engineers and services
a real example: a dev got OOMed after a release that coincided with a flash sale. he increased memory limits, and containers stopped crashing and it was "fixed". Actualy, a newly introduced internal module had a memory leak. adding RAM just hid the leak until the next traffic spike.
hyperprobe exists to capture actual in-memory runtime state during live traffic so you can prove the root cause before changing code or scaling infra in this case
Comment by skinfaxi 17 hours ago
Are you saying that hyperprobe would have in fact caught that issue?
Comment by karanraina 8 hours ago
Comment by tcdent 1 day ago
But when the pipeline fails (bugs happen that's fine) re-running the exact same process may not be the solution.
Where does the additional intelligence that wasn't there before come from? We ran the pipeline that got it to prod on the same exact models you have access to. So the value prop is that you read the logs automatically instead of a developer directing a debug session?
Comment by karanraina 1 day ago
your coding agent will have access to your code and can see what logs you have enabled, if indeed that would help in debugging, going that route helps. it can take your agents a bunch of retries but it might get there if the answer is in logs
what we provide your coding agent is a detailed snapshot of all your variables at any line it feels would help debugging. and not just in the current call frame.. even the variables of the callers of your current function, like a debugger.
suupose funcA() -> funcB() -> funcC() -> yourCurrentFn()
we'll provide all the variables that were set in all 4 functions to your agent. debugging using this would be a lot more accurate and you just one snapshot like this instead of looking at a thousand log lines to understand why something is not working the way you want to.
this kind of data is missing from your logs and and even your traces because it will be impractical for privacy and performance.
Comment by killix 1 day ago
Comment by jaggederest 1 day ago
A useful adjunct to this kind of production in-memory debugging is a read-only agent locked down role in AWS or equivalent. I believe amazon has just set up some kind of a wizard for configuring a role like this. It really gives agents the ability to relatively safely look at the prod setup without exposing sensitive details or making changes, especially with e.g. terraform
Comment by karanraina 1 day ago
Also thanks for the candid feedback! (And fair call on the design — we definitely prioritized shipping core functionality over UI polish, but point taken on the orange/brown palette, we'll change it)
Comment by tptacek 1 day ago
Comment by jaggederest 1 day ago
Comment by shailendraht 1 day ago
Comment by myshapeprotocol 1 day ago
Comment by shailendraht 1 day ago
Comment by iwasinnam 1 day ago
Comment by kzmttkc 1 day ago
Comment by neya 1 day ago
Comment by karanraina 8 hours ago
Comment by karanraina 1 day ago
a probe is basically just a definition it contains the file and line number of the code you want to inspect
that is safe by default. there's no custom userland function that you can call
if you want conditional probes, then it get's tricky
here's how it works
NodeJS: v8 natively blocks if the code even tries to produce side effects using `throwOnSideEffect: true`
in python and java: conditions can be set on local variables only without accessors as of now. you can call functions, can only a subset of comparison operators.
so, you can set `total > 50` as a condition but not `order.total > 50` as it could in theory trigger a getter (which ideally should be fine, but devs/agents can make getters with side affects so we wont allow it for now)
We will support these use cases with a custom DSL for agents + AST parsing in the future which will let us safely evaluate these expressions.
Comment by xms17189 1 day ago
Comment by karanraina 1 day ago
This is readonly and safe by default.
expressions come into play for conditonal probes
read only safety guarantees here depend on the runtime
NodeJS: handled implicitly by using `throwOnSideEffect: true` any side possible effects are prevented using this
Python and Java: As of now, we don't let conditions have method invocations at all and only allow a subset of comparator operators. no assignment allowed
usually property can invoke getter which usually should be safe to execute by design, but since we cant guarantee how it would have been written, we dont allow that as well for now.
order.total > 50 => not allowed
total > 50 => allowed
to get around this we use multiple probes, agrregated by the current context's traceId (if avaliable)
we plan to eliminate this problem by adding a custom DSL + AST parsing which can act as the policy layer to dissallow condtional probes
Audit trail is in our roadmap. As of now, you can delete the data that's collected by probes. the only problem we have with audit trail is what if you capture something sensitive and that remains in your audit trail.. so we need some immutability that registers audit trails.. but then have enough flexibility to remove the data collected.. can be done
Comment by dshubham 1 day ago
Comment by karanraina 1 day ago
It could work, the technology isnt the limitation.
But we were clear from day one that we cant let our sdks change the memory. Even if it helped solve a real problem.. say for example resetting a bad env variable or a feature flag without redeployment.
I might be biased from my experience, but i would prefer having a bug in my system for longer that i can reliably reason with than having it solved dynamically within the app which adds another thing to keep in my mind.
for me, bug -> fails -> good bug + dynamic patch -> works -> bad
also we dont think that we ourselves wont have any downtime ever, so we design for it. we'd not want to become as critical for your app as say your database.
As of now, your app works even if our servers are down/blocked/slow, adding the ability to change memory on the fly could change this
Comment by IgorVoytyuk 1 day ago
Running an autonomous pipeline for eight months, the three incidents that cost me the most days all had the surface error naming the wrong subsystem:
- "x264: malloc of size N failed / incorrect parameters" — I read it as a codec or bad-args bug and went looking there. It was RAM exhaustion. The encoder was the victim, not the cause.
- A 22x slowdown in an LLM step that was indistinguishable from a hang. It was swap: the model no longer fit in RAM, and the page file did the rest.
- A 27-minute "freeze" in a background job. The process was healthy; the pipe was buffering, so nothing appeared until exit.
In all three the logs were complete and the metrics were green. The mistake was in the inference drawn from them — and an agent will produce that wrong inference far faster than I did, with better prose attached to it.
So: does HyperProbe ever return "I don't know — here are two competing hypotheses and the cheapest check that separates them"? The discriminating check is the part I'd pay for. A single confident answer that's wrong is worse than no answer, because it sends a human down a road with the agent's credibility behind it.
Comment by karanraina 1 day ago
trying to debug using our tool might even lookup some memleak candidates in your primary container, but there wont be conclusive evidence for it and it would say so.
for in app errors all we do is hypothesize and either prove/disprove that using data from running system.
and whenever we do report something we give have the evidence for it. its not fool proof but just asking does this hypothesis gets proved with this evidence in a subagent mostly does the trick
Comment by IgorVoytyuk 12 hours ago
The class I never solved sits one level below that: a check that runs, passes, and is looking at the wrong object. My top-level health signal was green for three days while zero artifacts shipped. Sixteen daemons alive, backend responding, auth token valid — every organ it polled was genuinely healthy, and nothing measured the thing leaving the building. A missing k8s connector would not have helped; the data was all there and all correct.
Related one from the same eight months: 29 quality gates, written and unit-tested and committed, none of which was ever called, because nothing was a runner. The tests proved the gates worked. Nothing proved they were wired.
Do you see that shape at customers — monitoring correct, conclusion still wrong because it describes the process instead of the result? I ask because it decides what your diagnosis agent should be sceptical of: if the input signals can be individually true and jointly meaningless, evidence-checking inside the hypothesis does not catch it.
Comment by karanraina 8 hours ago
our snapshots give evidence, whether or not its helpful is determined by the engineer/ai agent
I'm not saying every issue would be diagnosed this way, sometimes, it might well be beyond your control like a VM on a noisy neighbour hogging shared CPU
we might get things wrong as well.